


Summary of Research Results
☑ Changes in output value and service
In Q1, the aftermarket output value and service visits both declined by 3% YoY, indicating overall weak terminal consumption vitality. However, the YoY declines narrowed in March, signaling a potential recovery.
In Q1, the YoY performance of service visits across different store operation models showed a trend reversal. Medium-to-large chain stores experienced a significant 8% YoY decline in service visits, which was notably higher than that of single stores and small chains.
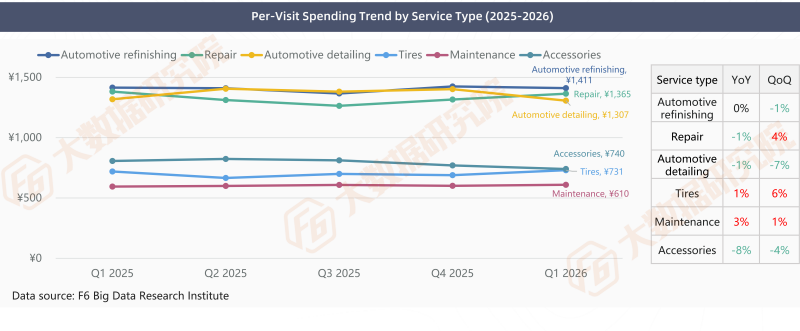
In Q1, the per-visit spending on both tire and maintenance services increased YoY. Notably, the per-visit spending on tire services rose significantly by 6% QoQ compared to Q4 2025.
☑ Category sales
In Q1, essential travel/safety categories such as tires and batteries achieved growth, while conventional maintenance categories like engine oil generally declined, reflecting a structural characteristic of "strong demand for essential safety parts and weak demand for conventional maintenance parts" in the industry.
In Q1, a significant divergence emerged between the northern and southern China markets from a regional perspective: multiple product categories achieved growth in southern China, while most categories in northern China continued their downward trend, indicating weaker market resilience.
In Q1, the average prices of gear oil and fuel filters increased significantly YoY, both rising by 7%. From a quarterly trend perspective, the prices of these two categories have generally maintained a slight and steady upward trend in recent years.
☑ Vehicle Brand
In Q1, among major automotive brands, BYD led in YoY growth of service visits with an 8% increase; Mercedes-Benz and Chery followed closely with a 3% YoY growth; while service visits for most brands, including Volkswagen, continued to show a YoY decline.
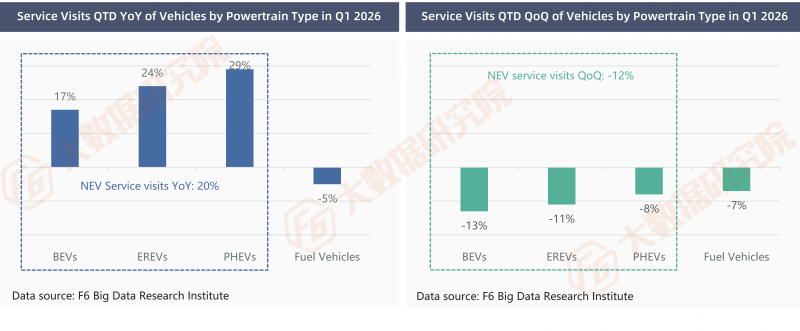
In Q1, service visits for NEVs increased by 20% YoY, while those for fuel vehicles declined by 5% YoY. From a QoQ perspective, service visits for fuel vehicles declined by 7%, while the drop for NEVs was as high as 12%.
In Q1, among the major NEV brands in the aftermarket, Xiaomi, benefiting from a low base in the same period of 2025, saw a substantial 142% YoY increase in service visits; AITO followed closely with a 67% YoY growth.
☑ Industry trends
In 2025, the number of motor vehicles in China reached 366 million, with NEVs accounting for 12.01% of the total. The number of motor vehicles exceeded 1 million in 103 cities across the country.
In Q1, the share of service visits from Tier 3 and lower cities approached 44%. In recent years, the share of service visits in lower-tier markets has been continuously increasing, which intuitively reflects the vast development space and business opportunities in these sinking markets.
Based on the performance data of Q1 2026 and the forecast of monthly trends in 2025, the cumulative output value and service visits in the aftermarket for the first half of 2026 are expected to narrow to -2% YoY.
Interpretation of Key Data
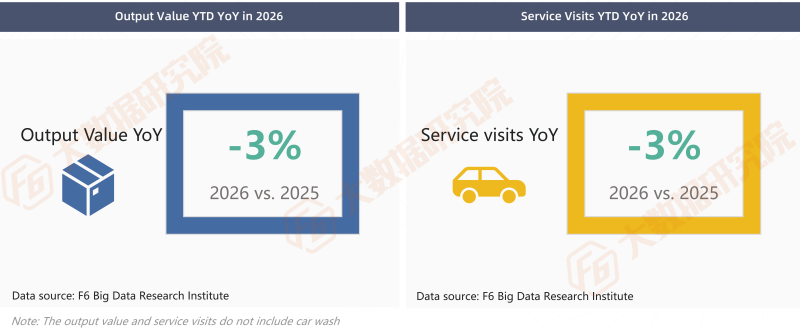
01、Output Value/Service Visits YTD YoY in 2026
In Q1 2026, the cumulative output value and service visits in China's automotive aftermarket both declined by 3% YoY, indicating an overall weakness in terminal consumption vitality. The "cautious wait-and-see" attitude on the consumer side, coupled with the dilution effect on conventional aftermarket business from the growing NEV parc, have both impacted the current market performance to some extent.
02、Service Visits YoY/QoQ by Powertrain Type in Q1
In Q1 2026, service visits for NEVs increased by 20% YoY, while those for fuel vehicles declined by 5% YoY. From a QoQ data comparison perspective, in Q1, service visits for fuel vehicles declined by 7% QoQ, while the output value only fell by 5%, indicating that the per-visit spending for fuel vehicle owners saw a significant short-term increase influenced by the Spring Festival factor. In contrast, EREVs and PHEVs showed the opposite trend, with a notable short-term decline in per-visit spending.
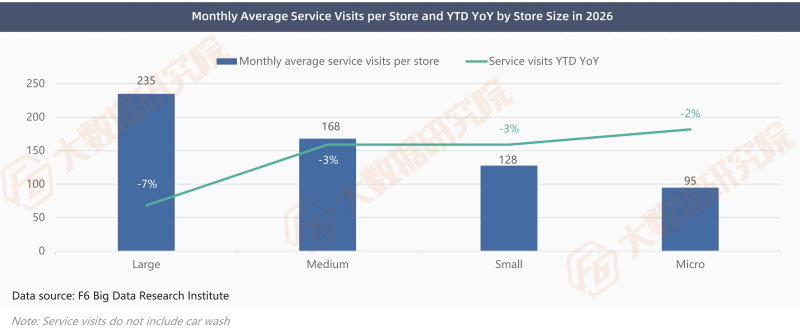
03、Service Visits YTD YoY by Store Size in 2026
In Q1 2026, the YoY change in aftermarket service visits was highly correlated with store size: the smaller the store, the narrower the YoY decline. Large stores averaged approximately 235 service visits per store per month. Influenced by the high base effect from the same period last year,their service visits exhibited more pronounced fluctuations,resulting in a YoY decline of 7%.
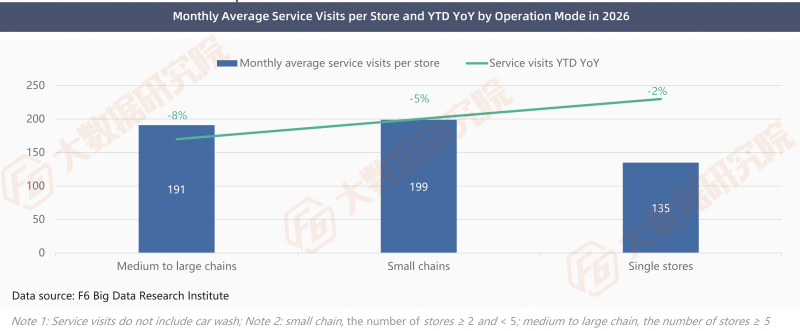
04、Service Visits YTD YoY by Operation Mode in 2026
In Q1 2026, the YoY performance of service visits across different store operation models showed a trend reversal. Medium-to-large chain stores experienced a significant 8% YoY decline in service visits, markedly higher than other store types. Some medium-to-large chains experienced a relatively rapid expansion pace in the earlier period and had a higher base in the same period last year. Against the backdrop of an overall weakening in terminal demand, their YoY decline was further amplified, showing a phase of pressure. F6 Big Data Research Institute will continue to track the subsequent trends.
05、Per-Visit Spending Trend and YoY by Service Type
In Q1 2026, the per-visit spending on both tire and maintenance services increased YoY, with that on tire services also showing a significant increase QoQ compared to Q4 2025. In contrast, the per-visit spending on detailing and accessories services declined both YoY and QoQ, reflecting a continued weakening in vehicle owners' willingness to spend on such non-essential services.
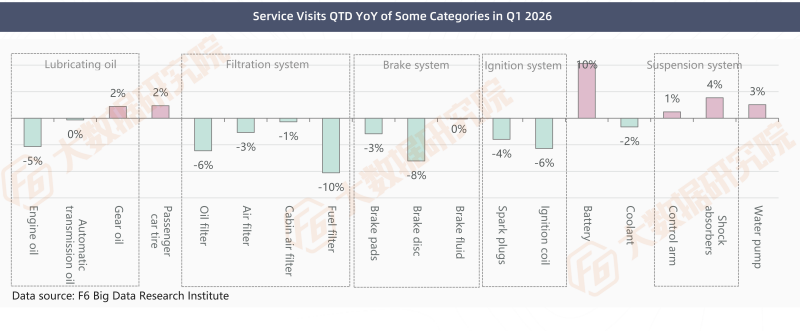
06、Service Visits YoY of Selected Categories in Q1
In Q1, the YoY performance of service visits across various product categories in the automotive aftermarket showed significant divergence: Essential travel/safety categories such as tires, batteries, and shock absorbers achieved growth, while conventional maintenance categories like engine oil and oil filters generally declined. The industry exhibited a structural characteristic of "strong demand for essential safety parts and weak demand for conventional maintenance parts."
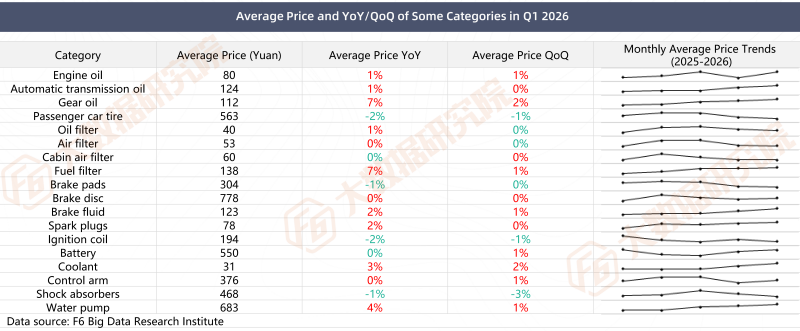
07、Average Price YoY/QoQ of Selected Categories in Q1
In Q1, the average prices of gear oil and fuel filters increased significantly YoY, both rising by 7%. From a quarterly trend perspective, the prices of these two categories have generally maintained a slight and steady upward trend in recent years.
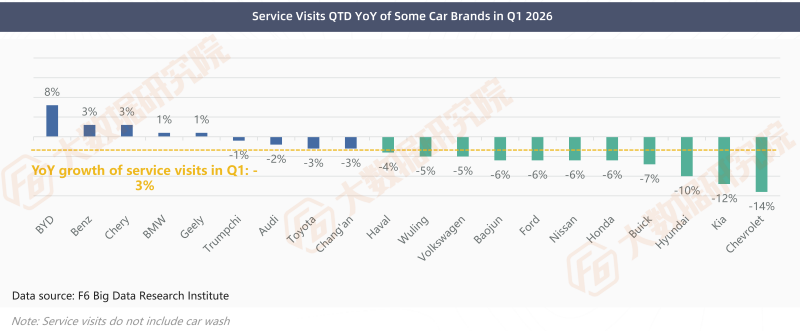
08、Service Visits YoY of Selected Vehicle Brands in Q1
In Q1 2026, the performance of service visits varied across automotive brands: BYD led with an 8% YoY increase; Mercedes-Benz and Chery followed closely with a 3% YoY growth; while the majority of brands, including Haval, Wuling, and Volkswagen, experienced YoY declines in service visits, with their drop rates all exceeding the aftermarket's average decline of 3%.
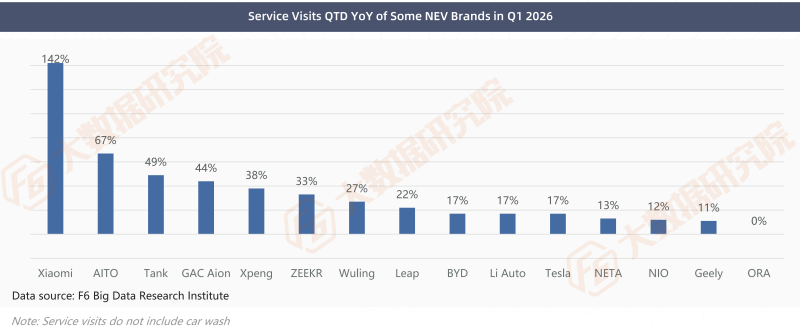
09、Service Visits YoY of Selected NEV Brands in Q1
In Q1 2026, the majority of brands in the NEV segment of the automotive aftermarket achieved positive YoY growth in service visits. Among them, Xiaomi, benefiting from a low base in the same period of 2025, saw its service visits surge by 142% YoY, marking the most prominent increase; AITO followed closely with a 67% YoY growth. Service visits for NEVs experienced overall rapid growth, reflecting a significant increase in the aftermarket's service capacity for NEV brands.
10、Industry Trends of Q1 2026
The vehicle parc reached 366 million units in 2025, with NEVs accounting for 12.01%; new vehicle sales declined YoY in Q1 2026.
→ Total Vehicle Parc Reached 366 Million by 2025
According to the data from the Ministry of Public Security, China's total motor vehicle parc reached 469 million in 2025, including 366 million passenger vehicles. 103 cities nationwide had vehicle parc exceeding 1 million units, with 7 cities - Chengdu, Beijing, Chongqing, Suzhou, Shanghai, Zhengzhou and Xi'an - each surpassing 5 million units. NEV parc totaled 43.97 million, accounting for 12.01% of all passenger cars. BEVs reached 30.22 million, representing 68.74% of NEVs, a 1.6% decline from 2024.
→ Multiple Factors Combined to Drive Down New Vehicle Sales YoY from January to March
According to data from the China Passenger Car Association, from January to March, the cumulative retail sales of passenger vehicles reached 4.226 million units, a YoY decrease of 17.4%. Among these, the retail sales of new energy vehicles were 1.908 million units, a YoY decrease of 21.1%. From a
monthly perspective, sales of passenger vehicles declined by 13.9% YoY in January, 25.4% YoY in February, and 15% YoY in March. This round of YoY decline was primarily influenced by a combination of multiple factors, including policy transition adjustments, the front-loading release of earlier demand, the timing shift of the Spring Festival holiday, relatively weak consumer willingness, and the high base from the same period last year.
→ A Surge in Lubricant Price Hikes Sweeping In
On March 9, Castrol issued a communication letter regarding market dynamics and ongoing cooperation; on March 13, Shell issued a lubricant price adjustment letter, to be implemented on April 6; on March 16, Mobil issued a price adjustment notice, stating that product prices will be adjusted starting April 1, with efforts to control the increase to around 8%; in addition, brands such as TotalEnergies, Fuchs, Valvoline, Gulf, and Petronas have successively issued communication or notification letters regarding product price risks, indicating a surging wave of lubricant price increases.
→ New regulations on Power Battery Recycling Clarify the Integrated Scrapping of Vehiclesand Batteries
In January 2026, six departments including the Ministry of Industry and Information Technology jointly issued the "Interim Measures for the Recycling and Comprehensive Utilization Management of Waste Power Batteries for New Energy Vehicles". These measures impose higher requirements for information transparency throughout the entire lifecycle of power batteries, including production, sales, maintenance, replacement, disassembly, recycling, and comprehensive utilization. They also stipulate that scrapped NEVs must be processed with their batteries intact to prevent procedural loopholes, with the exception of battery-swap models.